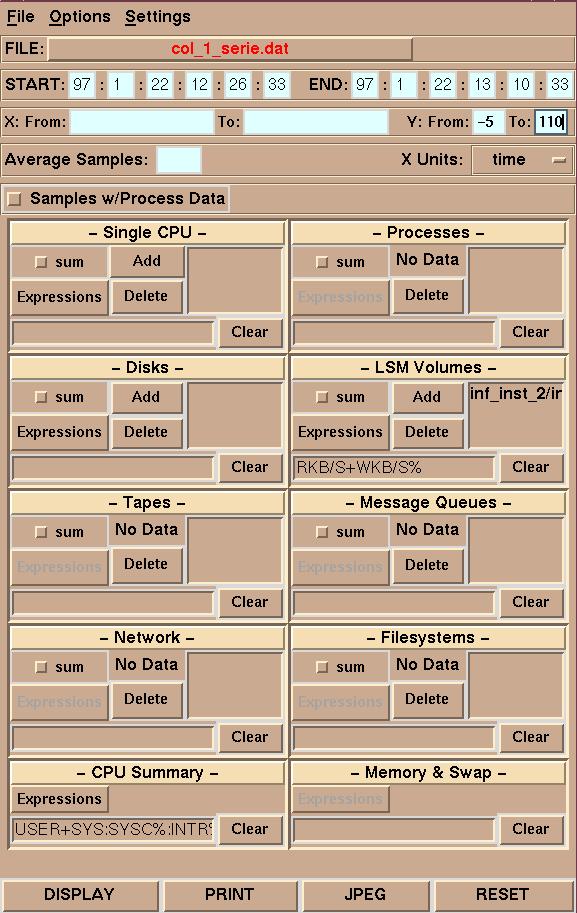
The following is a fairly old view of the collgui tool, but it gives an idea of how it works. Two subsystems have been selected for which data should be displayed: LSM and CPU Summary. The crucial element in deciding whether data from a particular subsystem should be displayed is whether there is an 'expression' in the 'expression entry window' (the long entry window at the bottom left of each subsystem box, to the left of the 'clear' button.)
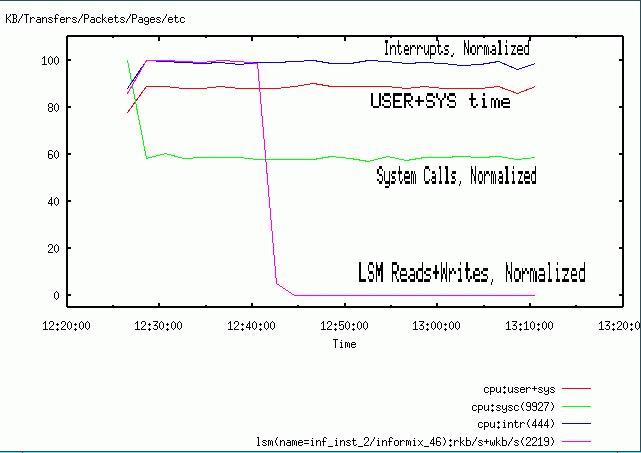
LSM: a single LSM Volume has been chosen, whose name is unfortunately too long to be displayed in the object window. Its name starts with "inf_inst_2/i...". For this volume a single curve will be graphed consisting of the sum of KiloBytes read and written. The percent sign "%" at the end means that the values will be normalized (divided by the highest value in the series and then multiplied by 100.). This forces all values to lie between 0 and 100. It is very useful when graphing dissimilar types of data simultaneously. For more information on the format of expressions see the cfilt manpage.
CPU Summary: since the CPU Summary subsystem by definition is a summary, it does not have multiple objects which can be selected (as opposed to LSM which has volumes, or DISK, which has disks, etc). Three curves will be graphed: one for the sum of USER and SYSTEM time, one for system calls (normalized), and one for interrupts (normalized).
Here you can see how the above settings are graphed.